As mentioned in the introductory article for fee types, a single fund can have multiple share classes with different fee structures related with the distribution of shares. This article shows the fee calculation model in action with a video.
In the screencast above (part 1, calculation) you can see how to calculate all sorts of fees for different share classes of a mutual fund. Analysis of the share classes will be handled in the next article (part 2, analysis). Related matlab and R files for calculations and analysis can be downloaded from the download page.
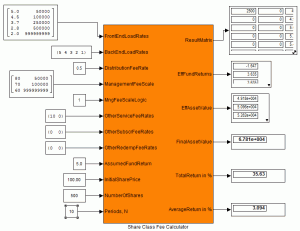 You can see the function block for fee calculation at the left with its input and output parameters. Note that some input and output parameters are vectors or matrices. Front-end load, back-end load and annual distribution fee rate are distribution related parameters that typically have different values for each share class. Result matrix is a comprehensive output parameter that contains all fees and other intermediate results for all investment periods. Effective fund return is the net annual performance of the fund after all fees. Similarly, effective asset value is the net asset value of the fund at each year-end after all fee outflows.
Total return is the final investment performance of the share class. For example, if you invest $10’000 in a fund’s shares and sell your shares for $15’000 (final asset value) after 5 years, the total return of your investment will be 50%.
Average annual return is also produced as an output so that you can compare fund’s return with the compounded interest rate of a simple saving account. In other words, average return is the geometric average of total return. For example, 21% total return in two years means an average annual return of 10% (1.10 x 1.10 = 1.21).
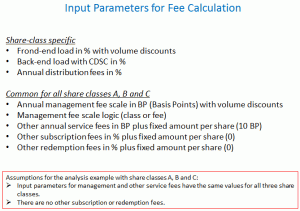 The figure at the left shows a list of all input parameters. For the exemplary share classes A, B and C as calculated and analyzed in matlab and R files I assumed that parameters like management fee scale, annual service fees etc. have same values for all share classes. In practice however, different share classes can have different management fee scales.
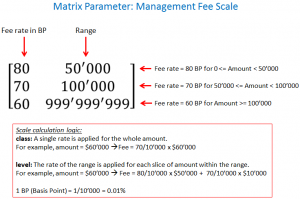 Management fees with volume discounts (i.e. tiered fee rates) can be calculated either with class or level logic.
In the class case, a single rate is applied on the whole asset value. In the level case, rate of the range is applied for each slice of amount within the range.
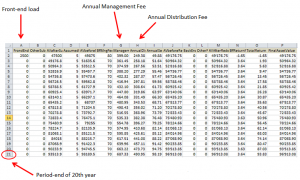 As shown in the figure at the left, the downloadable matlab or R file named Fee Calculator writes all the fee results into an excel file for all years from 1 to 20.
From front-end load to final asset value, all intermediate results can be reviewed conveniently in this excel sheet.
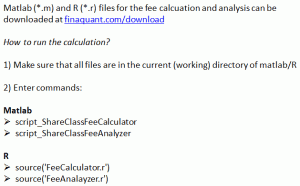 You need to execute this single script (FeeCalculator), either in matlab or R, in order to run the whole fee calculation for a share class.
It first sets values to all input parameters, then calls the main fee calculation function, and finally writes all results into an excel file.
Tunç Ali Kütükçüoglu, 5. May 2012
Supplementary PowerPoint slides as well as matlab and R files to run the fee calculation can be downloaded from the download page.
 Copyright secured by Digiprove © 2012 Tunc Ali Kütükcüoglu

