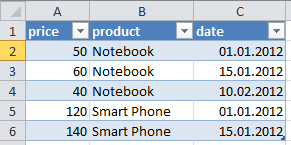
We use the simple notation introduced here for data tables in order to formulate:
- Information and reporting requirements
- Analytical operations on data tables
This table notation can generally be used for requirement engineering. I will use the same notation in the upcoming article about Information Content of Data Tables, a concept that I had developed about eight years ago.
Let’s begin with a simple data table with two key figures (numbers) and three attributes:

Note that, independent of the storage or processing technology (database, excel, XML file) every data table is conceptually a mathematical information unit.
As an example, that you need tables T1, T2, and T3 for a report means, you need the information content (table data + metadata) of all these tables in order to generate this report (by applying some operations on these tables). That is, the information content (IC) of the requested report must be covered by the aggregated information content of these three tables:
IC (T1,T2,T3) ⊇ IC (report) ⇔ report can be generated with f(T1,T2,T3,metadata)
.. where f is any set of operations like filtering, aggregation, combination etc. to be applied on tables.
I will elaborate more about the information content of data tables in an upcoming article. Let’s continue with the table notation.
Every key figure of a table like sales can be seen as a function of its attributes:
sales(product,category,date) = f(product,category,date)
On the other hand, there can be key figures or attributes whose values depend in turn on other key figures or attributes:
sales = quantity x price

category = f(product)
.. where the function f might be a 1-N hierarchical relationship between product and category.
A certain record (row) of a table can be indicated with field values instead of field names, in italic letters:
price,quantity(BMW E10,Economy,1. Jan 2010)

19687.75,39(BMW E10,Economy,1. Jan 2010)
| Download | Description |
| ExamplesInExcel | Zipped Excel file (+ pdf manual) with test tables for running some table operation examples like filtering, inserting related fields and aggregation mentioned in this article. |
| ExcelInstructionsPDF | A short and visual manual (pdf file) with instructions for running table operation examples in Excel. |
| VisualStudioProject | Zipped Visual Studio project for running table operation examples (filtering, inserting related fields, aggregation) in C#/.NET environment. |
Filtering/Selecting Rows of a Data Table (Row Partitioning)
Following examples show the notation for subtables that contain a selected set of rows of the original table.
Subtable with category = Luxury:
price,quantity(product,category=Luxury,date) = price,quantity(product,Luxury,date)
Subtable with category = Luxury AND date = 1.1.2010
price,quantity(product,Luxury,1.1.2010)
Subtable with category = Luxury OR Economy:
price,quantity(product,category={Luxury, Economy},date)
Subtable with category = Luxury OR date = 1.1.2010:
price,quantity(product,Luxury,date) UNION price,quantity(product,category,1.1.2010)
Note that recurring rows (i.e. recurring attribute-value-combinations) must be unified in a table union operation.
Extending Fields of a Data Table with Derived Key Figures
New fields can be inserted into a table through derived key figures:
price,quantity(product,category,date) → price,quantity,sales(product,category,date)
.. where sales = price x quantity
Extending Fields of a Data Table with Derived Attributes
New fields can be inserted into a table through derived attributes:
price,quantity(product,category,date) → price,quantity(product,category,date,year)
.. where year = YEAROF(date)
Reducing Number of Attributes through Aggregation
Metadata means information about the fields of data tables. Metadata contains information about the individual fields (i.e. key figures and attributes) and their relationships. As an example, a key figure relationship like sales = price x quantity belongs to metadata.
Assume, following aggregation relation is given in metadata:

What this equation means: Sales numbers can be aggregated over products to obtain sales per category, because there is a hierarchical 1-N relationship between product and category.
We can accomplish this aggregation in two steps. First, separation of key figures:
price,quantity,sales(product,category,date) → sales(product,category,date)
Aggregation of sales w.r.t. attribute product in the second step:
sales(product,category,date) → sales(category,date)
Valid and Invalid Table Operations
A table operation is valid only if the information content of the resultant output table is correct. Sounds complicated isn’t it? But it is in fact simpler than it sounds. Let me explain it with simple examples.
Assume, you have following table as original information (i.e. base table):
price(product,date)

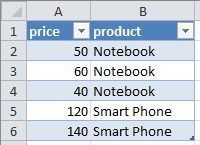
You could apply column-partitioning by brute force to select the columns price and product (i.e. exclude the column date) but the resultant subtable price(product) would not be correct:

Excluding the column date (column partitioning) is in this case an invalid operation because the data in the resultant table is not correct; prices are not constant as this table wrongly implies, they vary with date.
Similarly, we can’t aggregate prices over dates to obtain the prices per product, price(product). This would also be an invalid operation. An aggregation is valid only if such a relationship is defined (or permitted) in metadata.
There are some table operations that are always valid, independent of metadata. For example, separation or combination of key figures is always a valid operation, provided that they share the same set of attributes:
Separation of key figures:
price,quantity(product,country,date) → price(product,country,date)
Combination of key figures:
price(product,country,date) + quantity(product,country,date) → price,quantity(product,country,date)
In many cases, metadata will tell us if a table operation is valid or nor. For example, excluding an attribute from a table will be valid only if it is a function of other attribute(s). An operation like ..
price(product,category,date) → price(product,date)
.. will be valid if category = f(product), where the function f could be a hierarchical relationship.
After this introduction about notations and valid operations we are now ready to make a definition for the concept Information Content of Data Tables as a preliminary for the upcoming article.
Definition: Information Content of Data Tables
IC(Ta1,Ta2, .. TaN) ⊇ IC(Tb1,Tb2, .. TbM) ⇔ (Tb1,Tb2, .. TbM) = valid f(Ta1,Ta2, .. TaN)
Information Content (IC) of the tables (Ta1, Ta2, .. TaN) contains Information Content of the tables (Tb1, Tb2, .. TbM) if (and only if) all the tables in the second set (Tb1, Tb2, .. TbM) can be derived by applying some valid table operations on the first set (Ta1, Ta2, .. TaN).
While some table operations are always valid (like key figure separation/combination as shown above) metadata (information about fields and their relationships) will generally tell us which table operations are valid.
Written by: Tunç Ali Kütükçüoglu

