Table Functions of our .NET libraries finaquant® protos (non-commercial) or finaquant® calcs (commercial) can be used to formulate evaluation function (also known as objective or fitness function) and constraints in any optimization scenario quite easily without cumbersome database programming; following model example shows how.
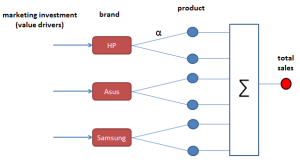
The output of an evaluation function can be measures like profit, time or costs, depending on the figure you want to minimize or maximize. In the following example, we want to get optimal marketing investment amounts per brand (value drivers) in order to maximize total profit from sales.
We will use Nelder-Mead Solver from Microsoft Solver Foundation (free .NET library) to find optimal investment amounts in this example.
You may download the Visual Studio project file with all the C# code required to run this example here.
Business Scenario
An online digital products dealer wants to increase its sales through advertisements on internet. Each ad will promote a certain brand (i.e. ads at brand level). The increase in sales for each product depends on (1) investment amount, and (2) sensitivity α of the product.

Formulas


Goal: Finding optimal marketing investment amount per brand to maximize profit
Input Tables
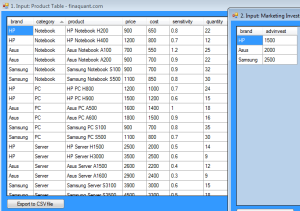
There are two input tables:
- Product table with key figures like price, cost, sensitivity and quantity (normal expected quantity without any advertisement)
- Marketing Investment table with initial (sub-optimal) investment amounts.

Following C# code shows how input tables are created:
Create Input Tables
using FinaquantCalcs; // define metadata MetaData md = MetaData.CreateEmptyMetaData(); MetaData.AddNewField(md, "brand", FieldType.TextAttribute); MetaData.AddNewField(md, "category", FieldType.TextAttribute); MetaData.AddNewField(md, "product", FieldType.TextAttribute); MetaData.AddNewField(md, "price", FieldType.KeyFigure); MetaData.AddNewField(md, "cost", FieldType.KeyFigure); MetaData.AddNewField(md, "profit", FieldType.KeyFigure); MetaData.AddNewField(md, "sensitivity", FieldType.KeyFigure); MetaData.AddNewField(md, "quantity", FieldType.KeyFigure); MetaData.AddNewField(md, "advinvest", FieldType.KeyFigure); MetaData.AddNewField(md, "advfactor", FieldType.KeyFigure); MetaData.AddNewField(md, "liftedqty", FieldType.KeyFigure); // create master product table var ProductTableFields = TableFields.CreateEmptyTableFields(md); TableFields.AddNewField(ProductTableFields, "brand"); TableFields.AddNewField(ProductTableFields, "category"); TableFields.AddNewField(ProductTableFields, "product"); TableFields.AddNewField(ProductTableFields, "price"); TableFields.AddNewField(ProductTableFields, "cost"); TableFields.AddNewField(ProductTableFields, "sensitivity"); TableFields.AddNewField(ProductTableFields, "quantity"); MatrixTable ProductTable = MatrixTable.CreateTableWithElements_A(ProductTableFields, "HP", "Notebook", "HP Notebook H200", 900.0, 650.0, 0.8, 22.0, "HP", "Notebook", "HP Notebook H400", 1200.0, 800.0, 0.7, 12.0, "Asus", "Notebook", "Asus Notebook A100", 700.0, 550.0, 1.2, 25.0, "Asus", "Notebook", "Asus Notebook A200", 900.0, 700.0, 0.9, 22.0, "Samsung", "Notebook", "Samsung Notebook S100", 900.0, 700.0, 0.9, 32.0, "Samsung", "Notebook", "Samsung Notebook S500", 1100.0, 850.0, 0.8, 30.0, "HP", "PC", "HP PC H800", 1200.0, 1000.0, 0.7, 24.0, "HP", "PC", "HP PC H900", 1500.0, 1200.0, 0.6, 15.0, "Asus", "PC", "Asus PC A500", 1600.0, 1400.0, 1.0, 18.0, "Asus", "PC", "Asus PC A600", 1800.0, 1500.0, 0.9, 16.0, "Samsung", "PC", "Samsung PC S100", 900.0, 700.0, 0.8, 35.0, "Samsung", "PC", "Samsung PC S500", 1100.0, 800.0, 0.7, 30.0, "HP", "Server", "HP Server H1500", 2500.0, 2000.0, 0.5, 14.0, "HP", "Server", "HP Server H3000", 3500.0, 2500.0, 0.6, 9.0, "Asus", "Server", "Asus Server A1500", 2600.0, 2200.0, 0.4, 12.0, "Asus", "Server", "Asus Server A1600", 2900.0, 2400.0, 0.3, 9.0, "Samsung", "Server", "Samsung Server S3100", 3900.0, 3000.0, 0.6, 15.0, "Samsung", "Server", "Samsung Server S3500", 4500.0, 3300.0, 0.5, 18.0 ); // view table MatrixTable.View_MatrixTable(ProductTable, "1. Input: Product Table"); // create advertisement investment table var AdvInvestTableFields = TableFields.CreateEmptyTableFields(md); TableFields.AddNewField(AdvInvestTableFields, "brand"); TableFields.AddNewField(AdvInvestTableFields, "advinvest"); MatrixTable AdvInvestTable = MatrixTable.CreateTableWithElements_A(AdvInvestTableFields, "HP", 1500.0, "Asus", 2000.0, "Samsung", 2500.0 ); // view table MatrixTable.View_MatrixTable(AdvInvestTable, "2. Input: Marketing Investment Table with initial sub-optimal amounts"); |
Formulating Profit with Table Functions
Following C# code shows how profit can be formulated with table functions.
Note: Row Transformer (MatrixTable.TransformRowsDic) is used to apply user-defined formulas on each row of extended product table.
Calculate Profit
using FinaquantCalcs; public class OptimizeInvestment { // global parameters private static int ctr = 0; private static MatrixTable _ProductTable; private static MatrixTable _AdvInvestTable; private static double _MaxTotalInvest = 30000; // Optimal Advertisement Investment for each brand public static void MarketingInvestment() { // Create input tables ... _AdvInvestTable = AdvInvestTable.Clone(); // insert new key figures into product table ProductTable = MatrixTable.InsertNewColumn(ProductTable, "advfactor"); ProductTable = MatrixTable.InsertNewColumn(ProductTable, "liftedqty"); ProductTable = MatrixTable.InsertNewColumn(ProductTable, "profit"); _ProductTable = ProductTable; // Add advertisement investment into product table var ProductTable2 = MatrixTable.CombineTables(ProductTable, AdvInvestTable); // view table MatrixTable.View_MatrixTable(ProductTable2, "ProductTable with adv investment"); // row-by-row processing: apply formula(s) on each row of product table // to calculate adv factor, lifted quantity and profit ProductTable2 = MatrixTable.TransformRowsDic(ProductTable2, CalculateProfit); // view table MatrixTable.View_MatrixTable(ProductTable2, "ProductTable with profit"); // total net profit double GrossProfitSales = KeyVector.SumOfAllElements(ProductTable2.GetColumnKeyFigure("profit")); double AdvCosts = KeyVector.SumOfAllElements(AdvInvestTable.GetColumnKeyFigure("advinvest")); double NetProfit = GrossProfitSales - AdvCosts; Console.WriteLine("Gross Profit from Sales = " + GrossProfitSales); Console.WriteLine("Advertisement Costs = " + AdvCosts); Console.WriteLine("Net Profit = " + NetProfit); Console.ReadKey(); } // Calculate adv factor, lifted quantity and profit for a product // Method called by row transformer private static void CalculateProfit( ref Dictionary<string, string> TextAttribDic, ref Dictionary<string, int> NumAttribDic, ref Dictionary<string, double> KeyFigDic) { // adv factor KeyFigDic["advfactor"] = LiftFactor(KeyFigDic["advinvest"], KeyFigDic["sensitivity"]); // lifted quantity KeyFigDic["liftedqty"] = Math.Round(KeyFigDic["advfactor"] * KeyFigDic["quantity"]); // profit KeyFigDic["profit"] = KeyFigDic["liftedqty"] * (KeyFigDic["price"] - KeyFigDic["cost"]); } } |


Finding Optimal Investment Amounts with a Constraint
Following C# code shows how optimal investment amount for brand each can be obtained with the Nelder-Mead Solver for non-linear optimization models without constraints.
In the code below, objProfit2() is the evaluation function.
Constraint: Total Marketing Investment <= $30000
Note: Nelder-Mead Solver can solve optimization models without constraints, but there is a way to outtrick this solver: Adding a high penalty to evaluation function if constraints are not satisfied. In this example, this penalty is formulated as follows:
double ConstraintPenalty = (Math.Sign(totInvest - MaxTotalInvestment) + 1) * 500000; |
#region OPTIMIZE WITH MS SOLVER FOUNDATION NelderMeadSolver int dim = AdvInvestTable.RowCount; var solverParams = new NelderMeadSolverParams(); // var solverParams = new HybridLocalSearchParameters(); var solver = new NelderMeadSolver(); // var solver = new HybridLocalSearchSolver(); int TotalProfit; int[] MarketingInvestment = new int[dim]; //add variables for (int i = 0; i < dim; i++) { solver.AddVariable(null, out MarketingInvestment[i]); solver.SetBounds(MarketingInvestment[i], 0, _MaxTotalInvest); } //add a row and set it as the goal solver.AddRow(null, out TotalProfit); solver.AddGoal(TotalProfit, 0, true); // initial investment amounts (starting point) for (int i = 0; i < dim; i++) { solver.SetValue(MarketingInvestment[i], AdvInvestTable.GetKeyFigValue("advinvest", i)); } solver.FunctionEvaluator = objProfit2; //Solve the model // goto t1; var solution = solver.Solve(solverParams); Console.WriteLine("========= OPTIMIZE ADV INVESTMENT PER BRAND WITH NelderMeadSolver =========="); Console.WriteLine("Max Profit: " + solution.GetSolutionValue(0)); Console.WriteLine("========Values========="); for (int i = 0; i < dim; i++) { Console.WriteLine("Xopt[{0}] = {1}", (i + 1), (double) solver.GetValue(i+1)); } Console.ReadKey(); #endregion OPTIMIZE WITH MS SOLVER FOUNDATION NelderMeadSolver // objective function, minimize negative profit private static double objProfit2(INonlinearModel model, int rowVid, ValuesByIndex values, bool newValues) { MatrixTable AdvInvestTbl = _AdvInvestTable.Clone(); for (int i = 0; i < AdvInvestTbl.RowCount; i++) { AdvInvestTbl.SetKeyFigValue("advinvest", i, values[i+1]); } // calculate net profit // Add advertisement investment to product table var ProductTable = MatrixTable.CombineTables(_ProductTable, AdvInvestTbl); // row-by-row processing: apply formula(s) on each row of product table // to calculate adv factor, lifted quantity and profit ProductTable = MatrixTable.TransformRowsDic(ProductTable, CalculateProfit); // total net profit double GrossProfitSales = KeyVector.SumOfAllElements(ProductTable.GetColumnKeyFigure("profit")); double AdvCosts = KeyVector.SumOfAllElements(AdvInvestTbl.GetColumnKeyFigure("advinvest")); // Total Investment double totInvest = 0; for (int i = 0; i < AdvInvestTbl.RowCount; i++) totInvest += values[i + 1]; double ConstraintPenalty = (Math.Sign(totInvest - _MaxTotalInvest) + 1) * 500000; return (0 - (GrossProfitSales - AdvCosts) + ConstraintPenalty); } |


Conclusions
This example demonstrates that table functions can be used to implement complex evaluation functions based on data tables (i.e. input tables) in optimization problems. Similar optimization problems may arise in many business fields including operational research, risk analytics and financial planning. That is, table functions can be used to support better and smarter business decisions.
 Copyright secured by Digiprove © 2014 Tunc Ali Kütükcüoglu

