As introduced in the related article, share classes of a mutual fund can have different fee structures appealing to different kind of investors. The question is, which share class is the best option with the highest net return considering factors like investment amount, investment horizon (duration) and expected fund returns?
The downloadable matlab or R file named FeeAnalyzer compares the investment performances of three exemplary share classes A, B and C, and generates some graphs which illustrate the analysis results.
 With its front-end load and low distribution fee share class A appeals typically to large and long-term investments. Share class B has a back-end load with CDSC scheme with a mid-range annual distribution fee. Share class C has neither front-end nor back-end load, but it has a high distribution fee in order to compensate for the distribution costs.
Let’s see the analysis results for these three share classes generated by FeeAnalyzer:
 Initial investment = 50’000, expected fund return = 5%:
Share class C (red curve) is the best option for short term investments, from 1 to 5 years. Share class B (green curve) is the highest return option for mid-term investments, from 6 to 8 years. Share class A (blue curve) is the best option for long-term investments with durations over 8 years.
What happens if we increase the investment amount from 50’000 to 250’000?
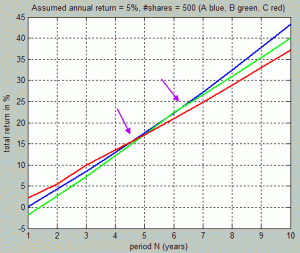
 Initial investment = 250’000, expected fund return = 5%:
The pattern for optimal share classes changes slightly compared to the first figure above. Share class B (green curve) is here the highest return one only for the 6. year, by a narrow margin compared to A (blue curve). Otherwise, share class C (red curve) is optimal for short-term investments with durations up to 4 years, and share class A (blue curve) is good for long-term investments over 7 years.The 5. period is a year of intense competition, with share class A (blue curve) as the lucky winner.
What if we increase the investment amount further from 250’000 to 500’000?
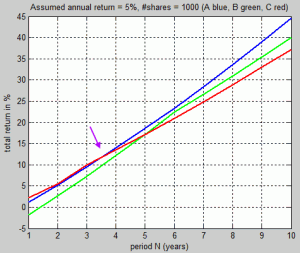
 Initial investment = 500’000, expected fund return = 5%:
At this level of investment, share class B (green curve) becomes an obscure option; for none of the investment periods it is the highest return class. Share class C (red curve) is still the best option for short-term investments up to three years. Share class A (blue curve) is the best option for long-term investments over 3 years.
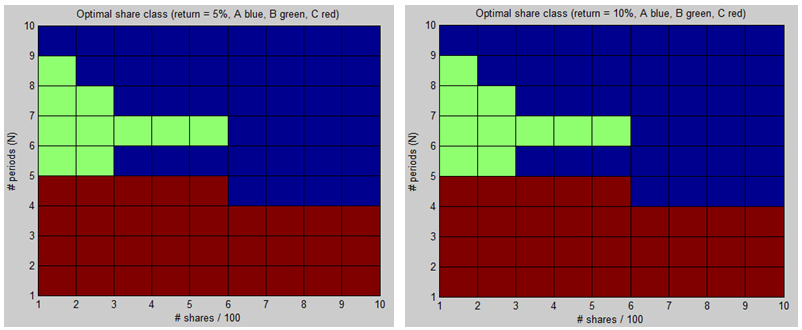
Summarizing all these analysis results, the color filled contour graphs below are what an investment strategist really wants to see:
Horizontal axis shows the investment amount changing from 50’000 to 500’000. Vertical axis shows the investment horizon changing from 1 to 10 years. We see the optimal share class by color coding for each year versus investment amount pair. Note that the initial price of a share is assumed to be 500.
For example, the highest-return share class for an investment amount of 200’000 (#shares/100 = 4) and an investment duration of 5 years is A (blue zone). Note that an increase of expected fund return from 5% to 10% doesn’t change the pattern for optimal share classes as a function of investment duration and amount (compare both graphs above).
The analysis results can be concluded as follows:
- Level load share class C (red) is good for short-term investments up to 4-5 years, depending on the investment amount.
- Front-end load share class A (blue) is good for large and long-term investments.
- Back-end load share class B (green) is good for smaller mid-term (5-9 years) investments.
Tunç Ali Kütükçüoglu, 7. May 2012
Supplementary PowerPoint slides as well as matlab and R files to run the fee analyzer can be downloaded from the download page.
 Copyright secured by Digiprove © 2012 Tunc Ali Kütükcüoglu


