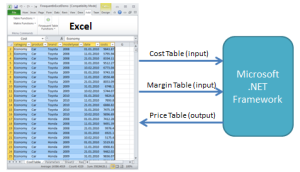
In a previous article I explained how sales commissions with tiered rates and product groups can be calculated using the table-valued functions of our .net library Finaquant Calcs.
In this article, I will explain how sales commissions can be calculated in Excel. The commission scenario is the same as explained in the previous article:
Commission Scenario
- Dealers receive sales commissions proportional to their sales totals for each product group in a quarter or month (commission or payment period).
- Product groups (or pools) can be defined by product category or individual products for each dealer.
- The commission scale with tiered rates (class or level scale logic) for each product group (or pool) determines the amount of commissions to be paid at the end of each commission period.
Steps for Commission Calculation
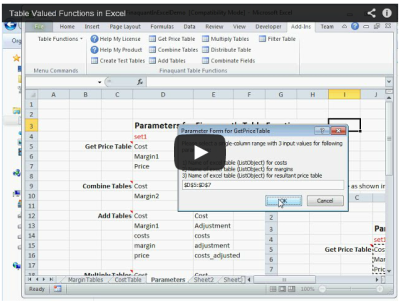
Following 2.5-minute video shows all the steps explained below:
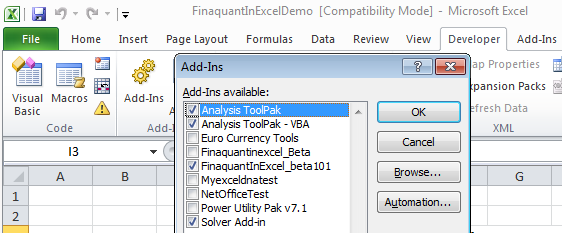
1) Download and install our Excel Add-in for Table Valued Functions. See Finaquant in Excel for downloads and installation
2) Run Create Test Tables to generate all the four input tables required for commission calculation:
 Continue reading


