
Important update on 16. February 2019: Some links, and especially download links on this website may not work properly as I recently transferred the whole site from www.finaquant.com to software.tuncalik.com
Check my shared folder MyAnalyticalSoftware_AllDownloads for most uptodate downloads. Open-Source downloads of the C#/.NET libraries Finaquant Calcs and Finaquant Protos are also included in this shared download folder as zipped Visual Studio 2012 files. You may contact me if you need consulting for my analytical software (C#/.NET, Matlab, Python, R).
Excel add-in named Finaquant in Excel that you can install within a minute makes Matrix, Vector and most importantly, Table-Valued Functions of .NET Library Finaquant Cals available for Excel users and programmers.
* For permanent use, a license is required for the underlying .net library Finaquant Calcs; not for the Excel add-in itself which is free and open source.
* See installation for requesting and validating a permanent license key.
* Owner of a permanent license can install and use all future releases of the .net library Finaquant Calcs.
* Don’t hesitate to contact us for any inquiries, special licenses (product, service etc.), training and project support.
| Download | Description |
| FinaquantInExcel_R105.xll | Excel add-in (Finaquant in Excel) for Table-Valued Functions, release 105, incl. basic matrix functions (digitally signed by Finaquant Analytics GmbH) |
| IntroToFinaquantInExcel.pdf | Introduction to Table-Valued Functions in Excel (add-in), release 30 Oct 2014; a Visual Guide with table function examples and developer notes. |
| FinaquantInExcelDemo.xls | Demo Excel file with a worksheet named Parameters for Getting Started |
| FinaquantInExcel_R105.zip | Zip package with Visual Studio project (C#/.NET) for developing the add-in Finaquant in Excel (open source) |
Table Valued Functions will transform your Excel into a Business Intelligence Tool, as Business Intelligence is all about:
- Table Valued Functions
- Data Visualization (reports, pivot tables, charts..)
Typical table calculations like Commission, Performance, Bonus, Financial Planning and Forecasting will become a matter of one-week configuration and testing with the table functions in Excel (rather than expensive software projects) provided that your machine can handle the performance and data size requirements.
Prerequisites for installing the Excel add-in:
- MS .NET Framework 4.0 (normally comes with Windows operation systems for free)
- MS Office Excel 2000 or above
Installation
- Download both the Excel add-in FinaquantInExcel_R105.xll and file FinaquantInExcelDemo.xls
- Open the Excel file FinaquantInExcelDemo.xls with the sheet named Parameters
- Go to Developer-tab (normally between View and Team), click on Add-Ins button, browse to the add-in file FinaquantInExcel_R105.xll and press OK

If you don’t see a Developer-tab in your Excel file you can add it by customizing the ribbon: Right-mouse menu on any Excel tab > Customize Ribbon > Check Developer group on the right side
Or another way for adding the add-in:
2. File > Options > Add-Ins > Manage [Excel Add-ins] GO
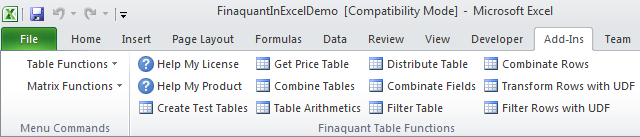
After a successful installation you should see a new menu named Table Functions in Menu Commands group in Add-Ins tab.
You will also see new buttons (Create Test Tables, Combine Tables..) in the new ribbon named Finaquant Table Functions. However, some older releases of MS Excel that doesn’t support ribbons may not show these buttons.

Troubleshooting
If you can’t install the add-in successfully, you may need to adjust your macro and add-in permissions:
File > Options > Trust Center > Trust Center Settings

Testing Table Functions in Excel
If everything went alright and you could install the add-in successfully, you can now begin to test the table functions in Excel. But first, create some test tables by clicking on the button Create Test Tables.
Your first table function: Select Columns
Select the function from the menu named Table Functions:

This simple table function creates a subtable with the selected fields (i.e. columns) of input table:

You can determine name of the resultant subtable (i.e. output table), sheet name for output table and the upper-left corner of this output table in the parameter form as seen above.
If the exclude option is checked, selected fields are excluded from the input table.
Your second table function: Round Key Figures
Round selected key figures of input table to given number of digits after decimal point:

Resultant output table with rounded key figures costs and price:

Your third table function: Table Arithmetics
Table Arithmetics is similar to matrix arithmetics, with the difference that attribute value combinations determine the outcome rather than the order of rows.
The kind of operation (addition, multiplication, subtraction or division) can be selected in the parameter form. In the following example, table multiplication is selected.
Assume you have a cost table, and you want to determine product prices with multiplicative margins as shown below:

For this example, I created the table named MultMargin manually. Now we can select parameters and multiply tables:

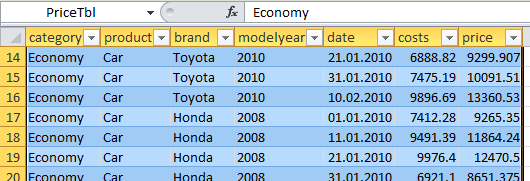
Following resultant table named PriceTbl will be inserted into an Excel sheet with the same name:
We strongly recommend you to download User Guide for other table function examples, license information and developer notes.
List of Table Functions in the Latest Release
| Table Function | Description |
| Create Test Tables | Creates several excel tables (ListObjects) |
| Combine Tables | Combine two input tables that have some common attributes (text or numeric). |
| Add Tables | Table Addition: Add two input tables with selected key figures. |
| Table Arithmetics | Add, Multiply, Subtract or Divide two input tables. |
| Distribute Table | Simple pro-rate distribution; returns table with distributed amounts. |
| Combine Field Values | Create a new table with all possible combinations of given field values in an input table. |
| Filter Table | Filter 1. input table (Base Table) with 2. input table (Condition Table). |
| Combinate Table Rows | Cartesian Multiplication of Table Rows: Generate a new table with all possible row combinations of input tables. |
| Aggregate Table | Aggregate all selected key figures of input table with the selected aggregation function. Resultant aggregated table contains selected attributes and key figures. |
| Transform Rows with UDF | Apply user-defined function (valid C# code) on every row of input table (Row Transformer). User-defined function can contain anything including if statements and other programming structures, provided that it is a valid C# code. |
| Filter Rows with UDF | Include or exclude table rows with a user-defined filter function (valid C# code) that returns true or false. Depending on exclude option, a row is included or excluded when user-defined filter function returns true. |
| Select Columns | Return a subtable with selected fields of input table. |
| Scalar Arithmetic Operation | Add, Multiply, Subtract or Divide selected key figures of input table by a scalar number like 2.5 |
| Round Selected Key Figures | Round selected key figures of input table to given number of digits after decimal point. |
| Insert New Field into Table | Insert a new field into input table. |
| Assign Random Numbers | Assign uniformly distributed random values to selected key figures and numeric attributes (of date or integer type) of input table, within the given lower and upper limits. |
| Sort Rows | Sort rows of table w.r.t. given fields and sort options (ASC/DESC). Comma-separated field names and sort options are entered like: category ASC, product DESC, .. |
| Insert Aggregate Key Figure | Insert a new (output) key figure which is the aggregate of selected (input) key figure w.r.t. selected reference attributes. For example, KF sales_per_category as aggregate of KF sales w.r.t. attribute category. |
| Append Tables Vertically | Append table2 to table1 vertically. Two input tables must have identical fields for this vertical append. |
| Append Tables Horizontally | Append table2 to table1 horizontally. Two input tables must have distinct fields with identical number of rows. |
| Simple Date Range Filter | Selects (or deselects if exclude option is checked) rows of input table within the given date range. |
| Date Filter | Filters rows of input table based on selected date field and period (month, quarter, year). Includes or excludes days considering date range as well as allowed period and week days. |
| Date Sampler | Samples dates for allowed period (month, quarter, year) and week days with the given search logic and returns a subtable with the source and target days. |
| Get Price Table (UDF) | Get price table with costs, margins and prices. Cost table must contain a key figure named costs, and margin table must contain a key figure named margin. Resultant price table contains all three key figures: costs, margin and price. Example for a User-Defined table function (UDF) |
| Sales Commissions (UDF) | Typical commission calculation with tiered rates and product poools (or groups). Calculates sales commissions per product pool and per dealer, given four input tables: Sales table (transactions), Commission-Scale table (tiered rates), Product-Pool table (defines product groups), Scale-To-Pool table (tiered rates per dealer and product group). Two output tables will be generated: Commissions per Product Pool, and Commissions per Dealer |
What can you do with this Excel add-in?
- As an Excel user you can use the table functions for various purposes.
- As an Excel programmer you can call the matrix, vector and table functions of Finaquant Calcs in VBA to develop some powerful macros.
- As an Excel and .NET programmer you can develop new table and matrix valued functions for your applications and distribute them as your customized excel add-in.
- As an Excel and .NET programmer you can use the source code of this excel add-in to integrate matrix and table functions of other .NET libraries with Excel.
More Information
- How to Add a User-Defined Table Function (UDF) to Excel
- Application Example: How to Calculate Sales Commissions with Tiered Rates for each Product Group in Excel
- Need help? Don’t hesitate to contact us if you need training or project support.
 Copyright secured by Digiprove © 2014 Tunc Ali Kütükcüoglu